An idealized cross-section showing the Hydrologic Components and common plants of Relict Glacial Drainageway wetlands. Drawing by Conrad Field.
Range map showing the location of Drainageway wetlands mapped in the Cook Inlet Basin.
Relict Glacial Drainageway wetlands are typically extensive peatlands formed in relict, sometimes abandoned, drainageway features. Drainageways are linear features which drained once more extensive glaciers. Some may have formed along the margins of a glacier. Some support modern streams but these streams are underfit, i.e. the modern stream geometry mismatches valley geometry. Drainageway peatlands are frequently fens, with a generally stable water level close to the surface, supported by ample groundwater throughflow that has had recent contact with mineral substrates.
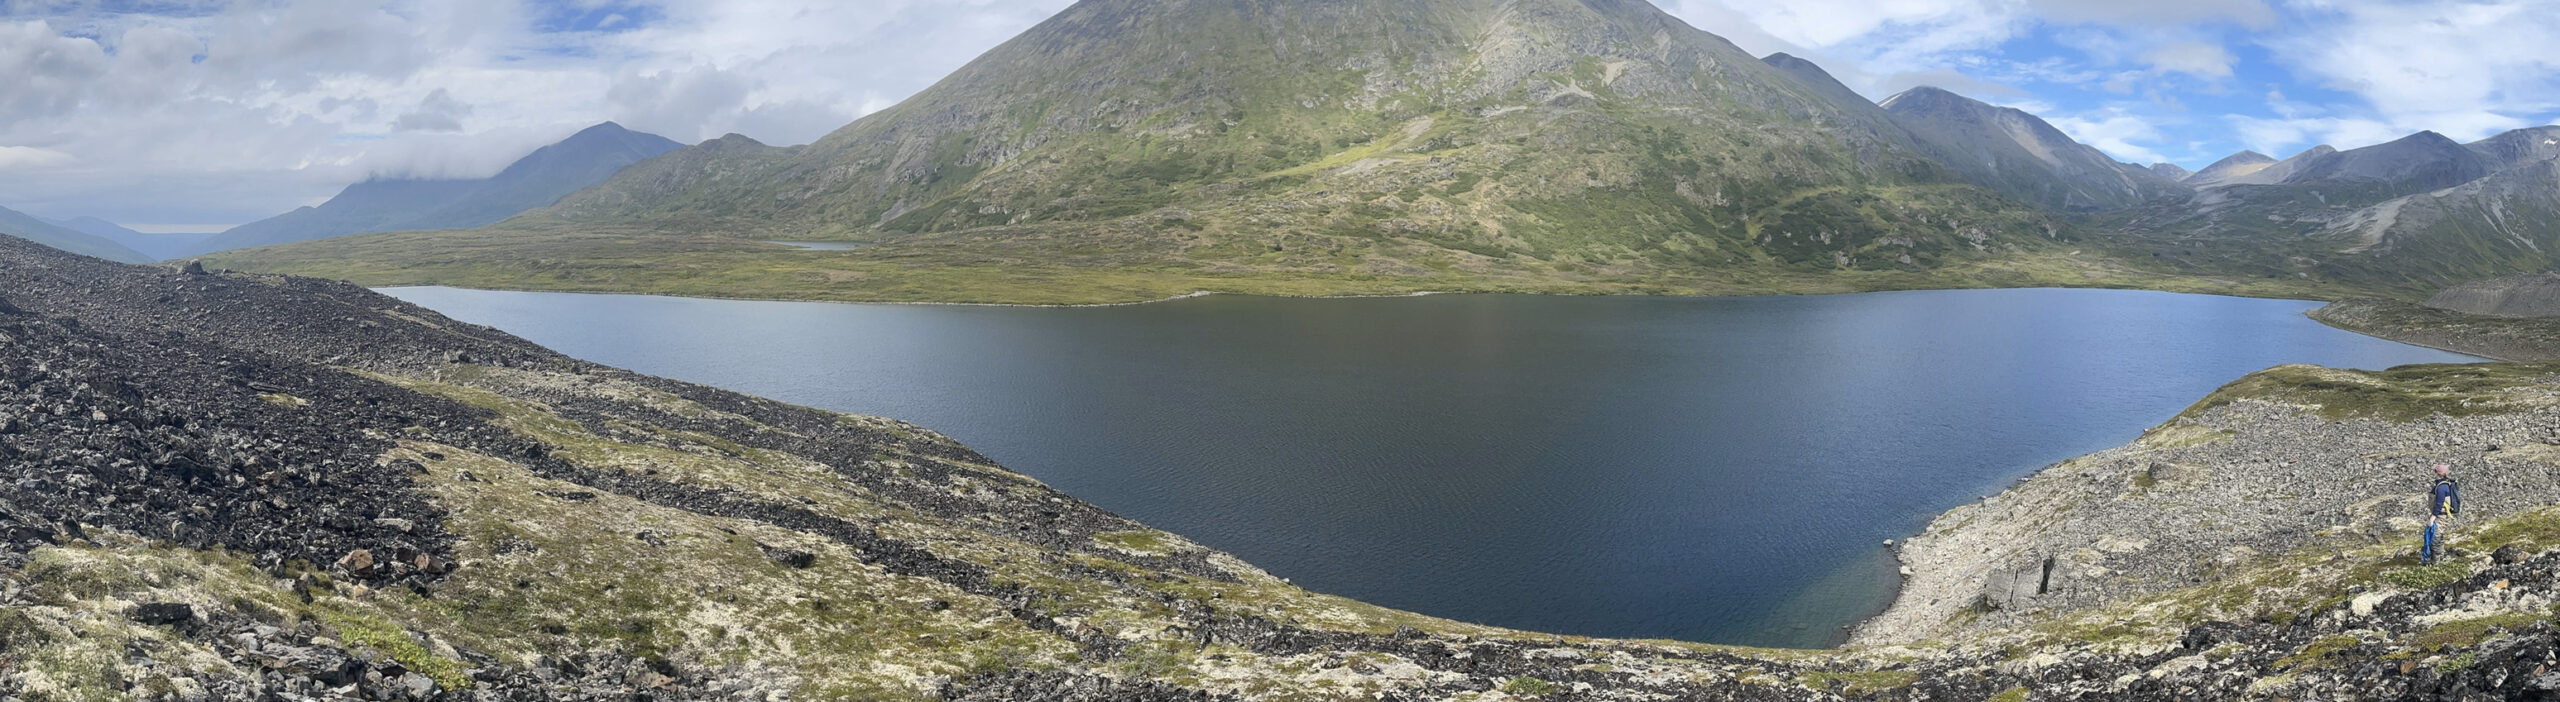
A Relict Glacial Drainageway draining into Threemile Lake in the Matanuska Valley.
Some Relict Glacial Drainageway wetlands lie along the margins of modern underfit streams. Underfit stream valleys formerly carried large volumes of meltwater from glaciers. An underfit stream is too small to have created the valley it now flows in. Valley meander bends may have a radius an order of magnitude or larger than the radius of meander bends now found along the stream channel..
Hydrologic Components of Drainageways and Lakebeds
Both the Relict Drainageway and Lakebed Geomorphic Components support six hydrologic components instead of the four that describe most of the other Geomorphologic Components (e.g. Kettles, Spring Fens, Depressions, VLD Troughs, and Headwater Fens). The hydrologic components for Drainageways and Lakebeds describe the same types, but are identified with different numbers. For example DW5 is the hydrologic component identifying a bog on Drainageways, but LB3 is the hydrologic component identifying a bog on Lakebeds; and DW4 is the hydrologic component identifying bluejoint reed grass on a Drainageway, while LB5 supports the same plant on a Lakebed. DW5A is a forest on a Drainageway, while LB6 is a forest on a Lakebed. These differences are due to the relationship of the components to the relative position and stability of the water table, which is different for Drainageways, whose porewaters receive ample groundwater inputs, than for Lakebeds, which receive a higher relative contribution from precipitation because they tend to have flatter gradients and underlying substrates that are less permeable. The hydrologic components attempt to describe relative wetness or dryness defined by the median position of the water table and its variability throughout the growing season. Therefore the same vegetation type (bog or Bluejoint) can grow in different relative positions on these different landforms. For example, a bog on a Drainageway (DW5) supports a deeper water table with more fluctuation than the shrubby portion of a Drainageway (DW3), and a bog on a Lakebed (LB3) tends to support a water table closer to the surface and with less variation than the shrubby portion of the Lakebed (LB4) (see the figure: “Plant Prevalence Index in Common Wetland Mapping Components” below).
NWI and HGM
Relict Glacial Drainageways are palustrine wetlands in the US Fish and Wildlife Service’s National Wetlands Inventory classification. Drainageways support a variety of Classes from herbaceous emergents (PEM) to shrubs (PSS) and forest (PFO). The forested subclass is almost exclusively needle-leaved evergreen, but occasionally it is mixed needle-leaved evergreen / broad-leaved deciduous. The shrub subclass is usually broad-leaved deciduous. Hydrologic regimes are generally saturated (B) in the shrub/scrub class (PSSB), although the seasonally flooded/saturated regime is often found where the PEM subclass (PEME) is encountered. The hydrologic regime in the forested subclass often does not fit any of the NWI regimes very well because PFOs on Drainageways do not often support standing surface water, and are only saturated to the surface for a sufficient time during the growing season to meet wetland conditions. Due to the short growing season in Cook Inlet Basin, this period of saturation may be only for a few weeks. The NWI hydrologic regime “saturated” requires saturation to the surface for “extended periods during the growing season”. The water chemistry modifier in Drainageways can be acidic or cicum-neutral (pH > 5.5 in the Cowardin system). The soils modifier is always organic.
In the LLWW Hydrogeomorphic classification of Tiner (2003) Relict Drainageway wetlands fall into two major types: those along streams are Lotic Stream Slope/Flat throughflow headwater wetlands and those without streams are mostly Terrene Slope/Flat groundwater-dominated throughflow headwater wetlands.
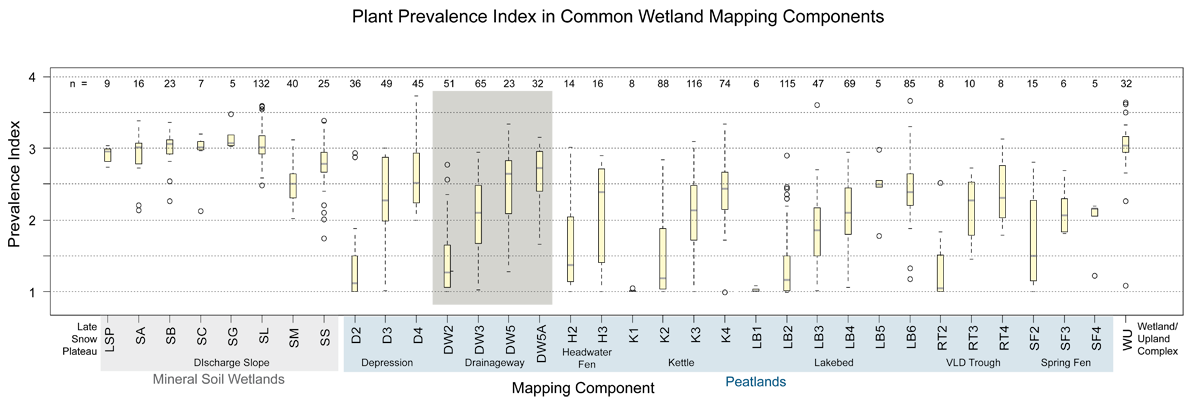
Box plots of Plant Prevalence Index (PI) in common wetland mapping components. Drainageway wetlands (highlighted in gray) mapped with lower hydrologic component values (DW2 vs. DW5 for example) have lower values for Plant Prevalence Index. Prevalence Index is a good proxy for water table position and variability. Lower values indicate a water table closer to the surface for a longer portion of the growing season. An Index value equal to one indicates that the plot supported only wetland obligate plants (occur in wetlands greater than 99% of the time under natural conditions). A Prevalence Index value greater than 3 suggests that the plot may not be a wetland for jurisdictional purposes. Bogs on Drainageways (DW5) and forested portions of Drainageways (DW5A) have correspondingly higher values for Prevalence Index than do bogs on Lakebed (LB3) or forested portions of other geomorphic components (e.g. LB6, K4, D4, or SF4). The higher values may indicate that some areas of drainageways support deeper water tables under forests or bogs than in other settings. Inclusions of upland forest are common in modern drainageways. The underlying well-sorted permeable sediments may allow better drainage during dry periods in Drainageways than in other settings where underlying sediments tend to be finer-grained.
Prevalence Index is calculated from the percent cover and the wetland indicator status of each plant found in a wetland plot. Lower values indicate a higher prevalence of plants assigned a wetland indicator status of obligate or facultative. Indicator status is assigned nationally, by state, and by regions within states. Prevalence Index may be a better descriptor of the variability of the water table than one-time measurements of the actual position of the water table. Measurements are often made before the water table has fully equilibrated, and are dependent on antecedent conditions. However, if Indicator Status is accurately assigned the plants present will integrate long-term average conditions.
In the box plots, yellow boxes enclose the first through third quartile (where 50% of the data values lie); the gray bar is the median, and the whiskers extend to the last value within 1.5 times the inner quartile range. Values lying beyond 1.5 times the inner quartile range are plotted as hollow circles. The number of samples for each map component is given across the top.
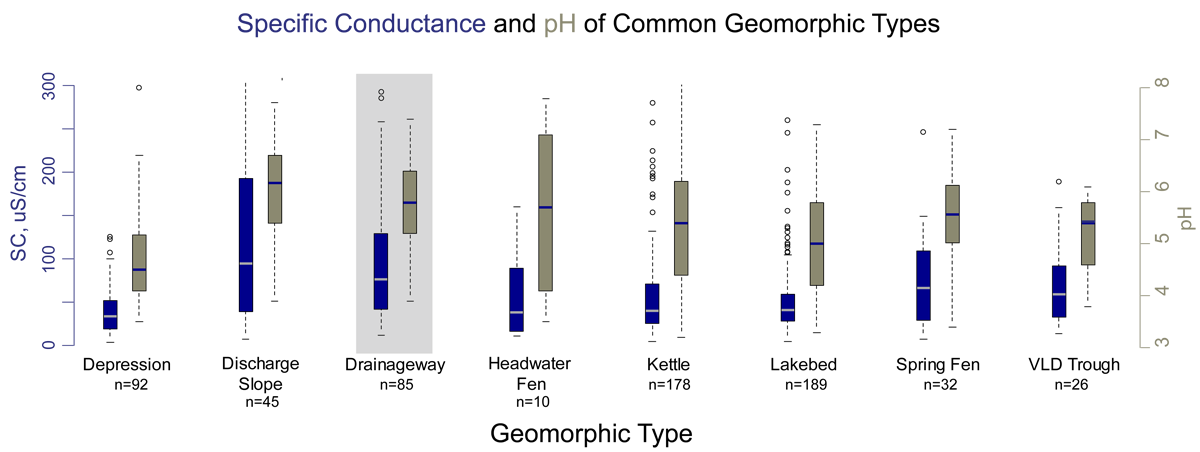
Box plots of specific conductance (SC- blue) and pH (brown) in the common geomorphic types. A few values for specific conductance greater than 300 micro-Siemens/cm are not shown. Drainageway wetlands (highlighted in gray) have generally higher pH and specific conductance when compared to wetlands in other common geomorphic settings in Cook Inlet Basin. The median values in Drainageways are higher than any other values for peatlands. The higher values indicate that ground water connections to the surface are relatively strong. The only higher values are for Discharge Slopes, the only non-peat forming wetlands plotted.
In box plots, the boxes enclose the first through third quartile (where 50% of the data values lie); the horizontal bar in the box is the median value, and the whiskers extend to the last value within 1.5 times the inner quartile range. Values lying beyond 1.5 times the inner quartile range are plotted as hollow circles.
Wetland Indicators
| Table 1. Wetland Indicators in Drainageway map components throughout the Cook Inlet Lowlands. | ||||||||
| Map Component | Peat Depth (cm) | Water Table (cm) | Redox features (cm) | Saturation (cm) | pH | Alkalinity mg/l as CaCO3 | Specific Conductance µS/cm | Plant Prevalence Index |
DW1 |
0 (1) | -10 (3) | 0 (1) | 0 (2) | 6.5 (5) | 130 (5) | 1.00 (2) | |
DW2 |
173 (51) | 6 (53) | 148 (5) | 1 (23) | 5.8 (40) | 17.8 (10) | 96 (31) | 1.43 (51) |
DW3 |
113 (68) | 20 (62) | 67 (7) | 3 (27) | 5.9 (36) | 17.1 (13) | 107 (30) | 2.09 (65) |
DW4 |
104(2) | 23 (2) | 4.5 (1) | 0.0 (1) | 2.92 (2) | |||
DW5 |
165 (23) | 29 (22) | 59 (4) | 8 (8) | 4.8 (12) | 1.1 (7) | 57 (10) | 2.44 (23) |
DW5A |
67 (35) | 31 (32) | 36 (7) | 14 (9) | 5.9 (7) | 42.1 (3) | 115 (6) | 2.64 (32) |
Explanation:
- Numbers in parentheses indicate number of samples.
- Peat depth is a minimum, because some sites had thicker peat deposits than the length of the auger used (between 160 – 493 cm).
- Water table depth is a one time measurement. At sites with seasonally variable water tables this measurement reflects both the conditions that year, and the time of year.
- Redox features with deep depths typically indicate deeper peat deposits, which mask redox indicators so the depth corresponds to the peat thickness.
- pH and specific conductance measured in surface water or a shallow pit with a YSI 63 meter calibrated each sample.
- Plant Prevalence Index calculated based on Alaska indicator status downloaded from the USDA PLANTS database, which may use different values than the 1988 list.
Soils and Plant Communities
| Table 2. Common soils and plant communities found in Drainageway wetlands. | ||
| Map Component | COMMON SOILS | COMMON PLANT COMMUNITIES |
DW2 |
STARICHKOF | Trichophorum caespitosum – Myrica gale |
DW3 |
STARICHKOF | Myrica gale – Betula nana / Equisetum fluviatile
Myrica gale – Dasiphora floribunda Myrica gale – Calamagrostis canadensis Salix barclayi / Calamagrostis canadensis / Comarum palustre |
DW4 |
STARICHKOF | Calamagrostis canadensis / Betula nana |
DW5 |
STARICHKOF | Salix barclayi / Calamagrostis canadensis – Equisetum arvense |
DW5A |
STARICHKOF | Picea x lutzii / Salix barclayi / Equisetum arvense / Empetrum nigrum
Picea mariana / Equisetum sylvaticum – Ledum palustre ssp. decumbens |
Cation Chemistry
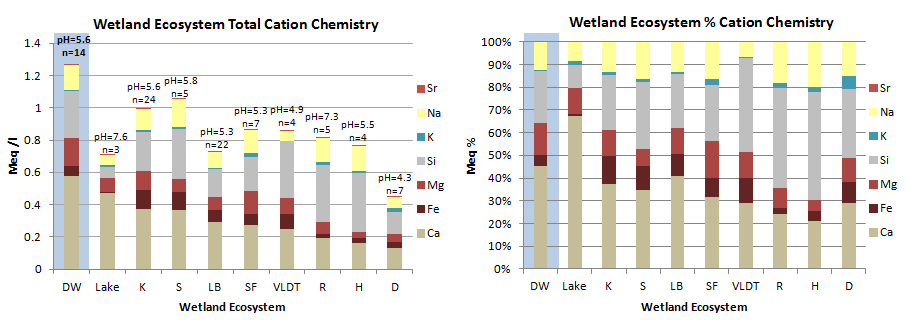
Cation chemistry by Geomorphic Component. Relict Glacial Drainageway wetlands (highlighted in blue) have the highest cation concentrations of any Geomorphic Component, indicating a strong groundwater source, and less precipitation influence than other components. Although calcium and silicon show the greatest concentrations, magnesium and iron concentrations in our area are high for natural waters. DW = Drainageway, K = Kettle; S = Discharge Slope; LB = Lakebed; SF = Spring Fen; RT = VLD Trough; R= Riparian; H = Headwater Fen; D = Depression.
Samples were collected from a surface pool where possible, otherwise from a separate shallow pit excavated to just below the water table. All samples were filtered through either a 0.2 micron filter using a disposable syringe, or pumped through a 0.45 micron filter using a peristaltic pump. Samples were acidified with ultra-pure nitric acid and kept cool until analysis on a direct current plasma spectrometer to about 5% accuracy (except K, 10-20% accuracy).
DRAINAGEWAY Hydrologic Components:
Map unit names are made of combinations of map components. A suffix ‘c’ indicates a created wetland, and a ‘d’ indicates a highly disturbed wetland.
DW1: Ponds in Drainageways.
- NWI: PEM1Hg
- HGM, LLWW: Terrene Slope/Flat Throughflow (headwater)
DW2: Drainageways with water table near the surface most of the growing season. Often dominated by sedges, dwarf birch and/or sweetgale.
- NWI: PEM/SS1Eg
- HGM, LLWW: Terrene Slope/Flat groundwater-dominated Throughflow (headwater)
DW3: Drainageways often dominated by medium-height shrubs.
- NWI: PSS1Bg
- HGM, LLWW: Terrene Slope/Flat groundwater-dominated Throughflow (headwater)
DW4: Drainageways dominated by Bluejoint reed grass (Calamagrostis canadensis).
- NWI: PEMBtg
- HGM. LLWW: Terrene Slope/Flat groundwater-dominated Throughflow (headwater)
DW5: Bogs along Draingeway margins dominated by thick Sphagnum moss, and often black spruce forests.
- NWI: PSS1B,3&4ag
- HGM, LLWW: Terrene Slope/Flat groundwater-dominated Throughflow (headwater)
DW5A: Forested Drainageways.
- NWI: PFO4Bg
- HGM, LLWW: Terrene Slope/Flat groundwater-dominated Throughflow (headwater)
| Table 3. Summary of Cook Inlet Relict Glacial Drainageway Map Unit occurrence. | ||||
| Map Unit | N | Hectares | % Polygons | % Area |
| DW1 | 9 | 19 | 0.04 | 0.01 |
| DW12 | 17 | 209 | 0.07 | 0.11 |
| DW12c | 1 | 0.5 | 0.00 | 0.00 |
| DW1-3 | 98 | 966 | 0.41 | 0.51 |
| DW1-3d | 1 | 2 | 0.00 | 0.00 |
| DW1-4 | 8 | 243 | 0.03 | 0.13 |
| DW1-5 | 10 | 88 | 0.04 | 0.05 |
| DW1-5A | 6 | 43 | 0.02 | 0.02 |
| DW1c | 3 | 2.6 | 0.01 | 0.00 |
| DW2 | 117 | 735 | 0.49 | 0.39 |
| DW21 | 63 | 826 | 0.26 | 0.44 |
| DW23 | 162 | 1411 | 0.67 | 0.75 |
| DW23d | 2 | 3.5 | 0.01 | 0.00 |
| DW24 | 7 | 42 | 0.03 | 0.02 |
| DW2-4 | 17 | 102 | 0.07 | 0.06 |
| DW25 | 12 | 115 | 0.05 | 0.06 |
| DW2-5 | 12 | 97 | 0.05 | 0.05 |
| DW25A | 18 | 105 | 0.07 | 0.06 |
| DW2-5A | 26 | 271 | 0.11 | 0.14 |
| DW2d | 1 | 0.4 | 0.00 | 0.00 |
| DW3 | 257 | 1485 | 1.07 | 0.79 |
| DW31 | 3 | 6.7 | 0.01 | 0.00 |
| DW32 | 171 | 1247 | 0.71 | 0.66 |
| DW34 | 15 | 89 | 0.06 | 0.05 |
| DW35 | 73 | 513 | 0.30 | 0.27 |
| DW3-5 | 8 | 86 | 0.03 | 0.05 |
| DW35A | 190 | 1677 | 0.79 | 0.89 |
| DW3-5A | 36 | 401 | 0.15 | 0.21 |
| DW3d | 4 | 12 | 0.02 | 0.01 |
| DW3T6 | 1 | 103 | 0.00 | 0.05 |
| DW4 | 23 | 72 | 0.10 | 0.04 |
| DW42 | 2 | 63 | 0.01 | 0.03 |
| DW43 | 6 | 49 | 0.02 | 0.03 |
| DW45 | 5 | 32 | 0.02 | 0.02 |
| DW45A | 10 | 74 | 0.04 | 0.04 |
| DW4-5A | 4 | 25 | 0.02 | 0.01 |
| DW5 | 143 | 832 | 0.59 | 0.44 |
| DW52 | 5 | 49 | 0.02 | 0.01 |
| DW53 | 45 | 339 | 0.19 | 0.18 |
| DW54 | 3 | 87 | 0.01 | 0.05 |
| DW55A | 97 | 711 | 0.40 | 0.38 |
| DW5A | 545 | 3453 | 2.27 | 1.84 |
| DW5A2 | 26 | 327 | 0.11 | 0.17 |
| DW5A3 | 186 | 1222 | 0.50 | 0.68 |
| DW5A3d | 1 | 2.0 | 0.00 | 0.00 |
| DW5A4 | 2 | 2.6 | 0.01 | 0.00 |
| DW5A5 | 68 | 857 | 0.28 | 0.46 |
| DW5Ad | 8 | 27 | 0.03 | 0.01 |
| DWR | 120 | 1268 | 0.50 | 0.68 |
| DWRd | 1 | 3.2 | 0.00 | 0.00 |