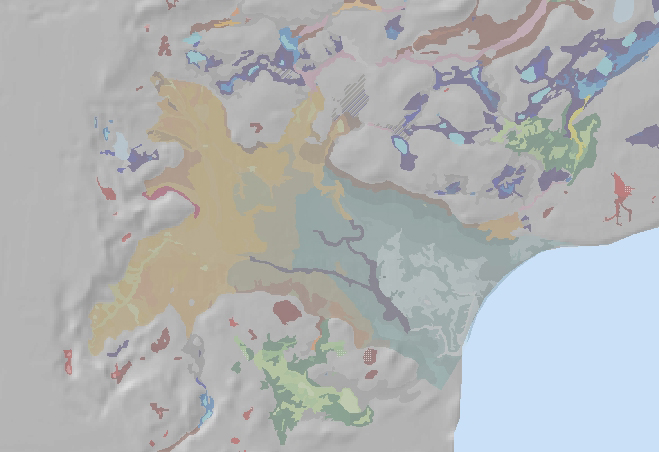
A shaded relief map showing the tidally-influenced wetlands in Goose Bay, on the western shore of Knik Arm
Tidally-Influenced Drainageway wetlands occur along the shores of Knik Arm. Goose Bay and Palmer Hay Flats State Game Refuge together support nearly all the Tidally-Influenced Drainageway Ecosystem wetlands in the area mapped. These wetlands are influenced by the extreme tidal range of Knik Arm, mixing with large amounts of freshwater discharging from the glacial sediments comprising the shoreline.
Tidal ranges vary daily, monthly, annually and on an 18.6 year cycle. The highest tide recorded in Knik Arm was 34.86 feet at 4:12 AM on 6 November 2002, although during some years the tide never exceeds 33.5 feet (NOAA, 2007; referenced to Mean Lower Low Water). Therefore, during some years the tide barely influences a zone from about 33 feet to 35 feet. This two foot elevation distance can cover a large area over the gentle gradients encountered in the Palmer Hay Flats and Goose Bay Refuges.
Tidally-Influenced Drainageways support an extremely broad gradient from fresh to saltwater controlled by multiple processes. Salinity can be as low 4 PSU in upper Cook Inlet (KABATA, 2005). Average seawater salinity is about 35 PSU (practical salinity units, or grams per kilogram of seawater). Freshwater from two sources dilutes salinity, and high tide residence time is of short duration.
The first source originates from glacially-fed river systems. These systems input large amounts of freshwater during the growing season. River water dilutes saltwater through sub-surface processes as well. A zone of shallow groundwater lies adjacent to all stream and river systems, and can extend for more than a mile (the hyporrheic zone). The hyporrheic zone is where river water moves below the surface, through adjacent sediments. High flow in broad, low-gradient valleys with permeable sediments, as found in upper Knik arm, results in a wide hyporrheic zone.
In addition to hyporrheic water, a large amount of groundwater is discharged from the permeable deposits underlying much of the area between Palmer and Houston (Jokela, et. al., 1991). In Goose Bay this discharge appears to float a layer of peat about one meter thick, over a lens of water 4 meters deep. The surface elevation at the highest point is about 40 feet, well above the range of the highest recorded tide. The surface of the strongly gleyed mineral soil beneath the floating peat lies at about 30 feet, near the level of mean higher high water (29.16′), indicating almost monthly intrusion of saltwater. The water near the surface is dilute; the average specific conductance of five surface water measurements at the high point on the mat was 135.3 µS (25°C; Table 1), close to values commonly encountered in local streams.
Already diluted saltwater (by both surface and groundwater inputs) is further diluted during the ample time between tides. The uppermost zone is inundated by only the highest tides of the 18.6 year cycle. Additionally, the highest tides often occur outside the growing season. These factors of the high variation in tidal range, timing, low initial salinity, high groundwater discharge, and hyporrheic input of the large river systems combine to support plants not normally considered halophytic (salt-loving), including balsam poplar forest, over soils indicating periodic tidal inundation.
These unique wetlands are classified into the Tidally-Influenced Drainageway wetland ecosystem. This system is divided into two major zones, one where the tide influence seems to dominate (TDW), and the other where freshwater influence seems dominant (DWT). The zones where tidal influence is more frequent, approximately monthly, are classified into the Tidal Wetlands Ecosystem.
| Table 1. Wetland Indicators in Tidally-Influenced Drainageway Ecosystem Map components | |||||||
| Map Component | Peat Depth (cm) | Water Table (cm) | Redox features (cm) | Saturation (cm) | pH | Specific Conductance µS/cm | Plant Prevalence Index |
DWT1 |
34 (1) | -12 (1) | 34 (4) | -12 (1) | 7.1(2) | 434.4 (2) | 1.00 (1) |
DWT2 |
414(3) | 2.7 (3) | 414 (3) | 0 (3) | 5.8(3) | 135.3 (3) | 1.28 (2) |
DWT3 |
433(2) | 7 (2) | 371 (1) | 2 (2) | 5.5(2) | 130.2 (2) | 1.89 (2) |
TDW2 |
119 (2) | -4.5 (2) | 53 (1) | -5 (2) | 6.8 (2) | 391.7 (2) | 1.05 (2) |
TDW3 |
70 (3) | 52 (2) | 9 (2) | 9 (2) | 6.8 (2) | 399.0 (2) | 2.04 (2) |
TDW5A |
14 (1) | 188 (1) | 8 (1) | 188 (1) | 3.58 (1) | ||
Explanation:
- Peat depth is a minimum, because some sites had thicker peat deposits than the length of the auger used (usually 493 cm).
- Water table depth is a one time measurement. At sites with seasonally variable water tables this measurement reflects both the conditions that year, and the time of year.
- Redox features with low n and deep depths typically indicate deeper peat deposits, which mask redox indicators.
- pH and specific conductance measured in surface water or a shallow pit with a YSI 63 meter calibrated each sample.
- Plant Prevalence Index calculated based on Alaska indicator status downloaded from the USDA PLANTS database, which may use different values than the 1988 list.
| COMMON SOILS | COMMON PLANT COMMUNITIES |
| TYPIC CRYAQUENTS
HISTOSOLS |
Buckbean
Barclay willow – bluejoint reedgrass Water sedge – marsh fivefinger Thinleaf alder / sweetgale / bluejoint reedgrass |
Explanation:
- Soils from 1998 Soil Survey of the Matanuska-SusitnaValley Area, Alaska, available online, follow the link in the table heading.
- Plant communities based on Kenai Peninsula wetland mapping and soil survey, or other published accounts, especially Viereck, et.al., 1992.
especially Viereck, et.al., 1992.
Tidal-Drainageway Ecosystem Wetland Map Components:
Map unit names are made of combinations of map components. A suffix ‘c’ idicates a created wetland, and a ‘d’ indicates a highly disturbed wetland.
DWT/TDW1: Open water
DWT/TDW2: Water table near the surface most of the growing season, often dominated by sedges.
DWT/TDW3: Deeper, variable water table, often dominated by shrubs, especially sweetgale, barclay willow, and thinleaf alder.
DWT4: Dominated by bluejoint reedgrass. (only present as a component in a single complex polygon)
DWT/TDW5A: Forested, typically by black spruce.
DWTR: A complex of more than two non-consecutive components. Often a narrow water course fringed by shrubs and forest.
| Table 3.Summary of Matantuska-Susitna Valley and Cook Inlet Discharge Slope Map Unit occurrence (percentages of all wetlands). | ||||||||
| Map Unit | MatSu N | Cook Inlet N | Mat Su Hectares | Cook Inlet Hectares | Mat Su % Polygons | Cook Inlet % Polygons | MatSu % Area | Cook Inlet % Area |
| DWT1 | 16 | 16 | 17 | 17 | 0.24 | 0.07 | 0.04 | 0.01 |
| DWT12 | 9 | 9 | 65 | 65 | 0.14 | 0.04 | 0.15 | 0.03 |
| DWT1-3 | 5 | 5 | 87 | 87 | 0.08 | 0.02 | 0.20 | 0.05 |
| DWT2 | 45 | 45 | 294 | 294 | 0.68 | 0.19 | 0.69 | 0.16 |
| DWT21 | 34 | 34 | 286 | 286 | 0.51 | 0.14 | 0.67 | 0.15 |
| DWT23 | 10 | 10 | 180 | 180 | 0.15 | 0.04 | 0.42 | 0.10 |
| DWT23c | 1 | 1 | 1.6 | 1.6 | 0.02 | 0.00 | 0.00 | 0.00 |
| DWT25A | 3 | 3 | 29 | 29 | 0.05 | 0.01 | 0.07 | 0.02 |
| DWT2-5A | 1 | 1 | 11 | 11 | 0.02 | 0.00 | 0.03 | 0.01 |
| DWT2d | 1 | 1 | 4.6 | 4.6 | 0.02 | 0.00 | 0.01 | 0.00 |
| DWT3 | 19 | 19 | 195 | 195 | 0.29 | 0.08 | 0.46 | 0.10 |
| DWT35A | 7 | 7 | 62 | 62 | 0.11 | 0.03 | 0.14 | 0.03 |
| DWT45A | 1 | 1 | 2.4 | 2.4 | 0.02 | 0.00 | 0.01 | 0.00 |
| DWT5A | 19 | 19 | 142 | 142 | 0.29 | 0.08 | 0.33 | 0.08 |
| DWT5A3 | 3 | 3 | 36 | 36 | 0.05 | 0.01 | 0.08 | 0.02 |
| DWT5Ad | 1 | 1 | 0.5 | 0.5 | 0.02 | 0.00 | 0.00 | 0.00 |
| DWTR | 1 | 1 | 1.8 | 1.8 | 0.02 | 0.00 | 0.00 | 0.00 |
| TDW1 | 15 | 15 | 186 | 186 | 0.23 | 0.06 | 0.44 | 0.10 |
| TDW12 | 1 | 1 | 34 | 34 | 0.02 | 0.00 | 0.08 | 0.02 |
| TDW1-3 | 3 | 3 | 10 | 10 | 0.05 | 0.01 | 0.02 | 0.01 |
| TDW1-5A | 2 | 2 | 63 | 63 | 0.03 | 0.01 | 0.15 | 0.03 |
| TDW2 | 19 | 19 | 368 | 368 | 0.29 | 0.08 | 0.86 | 0.20 |
| TDW21 | 5 | 5 | 324 | 324 | 0.08 | 0.02 | 0.76 | 0.17 |
| TDW23 | 9 | 9 | 547 | 547 | 0.14 | 0.04 | 1.28 | 0.29 |
| TDW2-5A | 2 | 2 | 6.1 | 6.1 | 0.03 | 0.01 | 0.01 | 0.00 |
| TDW3 | 8 | 8 | 225 | 225 | 0.12 | 0.03 | 0.53 | 0.12 |
| TDW32 | 6 | 6 | 255 | 255 | 0.09 | 0.02 | 0.60 | 0.14 |
| TDW35A | 6 | 6 | 59 | 59 | 0.09 | 0.03 | 0.14 | 0.02 |
| TDW3c | 1 | 1 | 0.5 | 0.5 | 0.02 | 0.00 | 0.00 | 0.00 |
| TDW5A | 4 | 4 | 108 | 108 | 0.06 | 0.02 | 0.25 | 0.06 |
| TDW5A3 | 2 | 2 | 30 | 30 | 0.03 | 0.01 | 0.07 | 0.02 |